
Join 60,000+ competitive exam aspirants
or with email
Your Cart
Subtotal₹0
Total₹0
Examoogle • User • info@examoogle.com • EE-2024-8821
Chapter 1 of 12 • Page 1 of 248🔒 Protected PDF • Watermarked
Join 60,000+ competitive exam aspirants
Study the given graph and answer the question that follows.
The line graph shows the number of scooters produced in a factory during the first six months of a year.
[Graph Data Table]
| Month | Number of Scooters |
|---|---|
| Jan | 150 |
| Feb | 250 |
| Mar | 300 |
| April | 200 |
| May | 250 |
| June | 350 |
What is the difference between the maximum and minimum production of scooters in a month?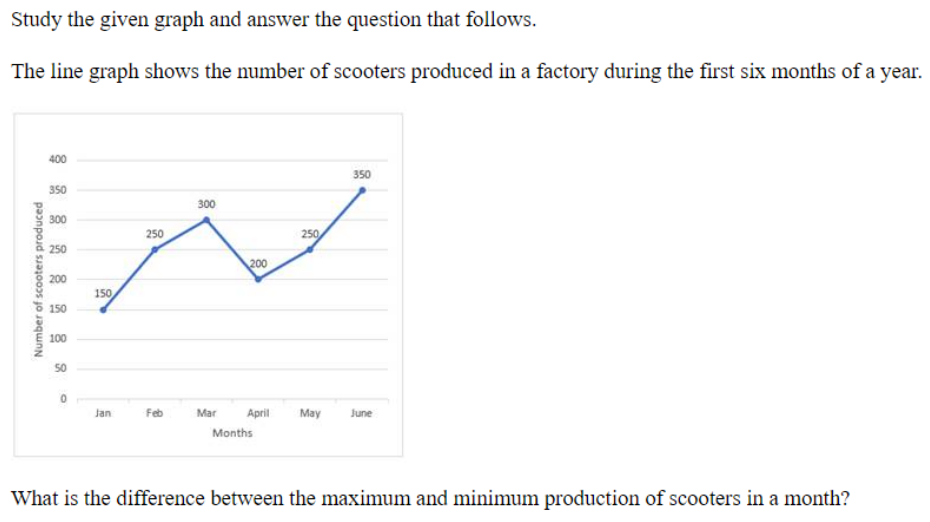
150
200
250
300
250
Identify the highest point on the line graph (June=350) and the lowest point (Jan=150). Subtract the smaller from the larger to get the difference.
Number of scooters produced per month: Jan=150, Feb=250, Mar=300, April=200, May=250, June=350.
Difference=Max Value−Min Value
Identify the highest point on the line graph (June=350) and the lowest point (Jan=150). Subtract the smaller from the larger to get the difference.
Students often pick February (250) or April (200) as the minimum, forgetting to check the very first month (January) which is 150.
Identify Maximum Production
Looking at the line graph, the highest point reached by the production line corresponds to June.
Max=350
Identify Minimum Production
Looking at the line graph, the lowest point on the chart is the starting point in January.
Min=150
Calculate the Difference
Subtract the minimum production value from the maximum production value to find the required difference.
350−150=200
C is correct because the maximum production is 350 (in June) and the minimum is 150 (in January), so the difference is 350 - 150 = 200.
This concept of finding the Range (Max - Min) is foundational for Statistics, particularly when calculating the dispersion of datasets in later data interpretation modules.
Get instant step-by-step AI explanations, full shift Previous Year Papers (SSC GD, RRB, SSC JE), and regional rank analysis on the official Examoogle App.
 Free Download • 100K+ Aspirants