
Join 60,000+ competitive exam aspirants
or with email
Your Cart
Subtotal₹0
Total₹0
Examoogle • User • info@examoogle.com • EE-2024-8821
Chapter 1 of 12 • Page 1 of 248🔒 Protected PDF • Watermarked
Join 60,000+ competitive exam aspirants
Study the following chart and answer the question that follows.
Exports of two companies over months (in crores):
| Month | Company X | Company Y |
|---|---|---|
| January | 95 | 200 |
| February | 40 | 100 |
| March | 85 | 185 |
| April | 60 | 130 |
What is the total exports by Company X and Y in months of January and March?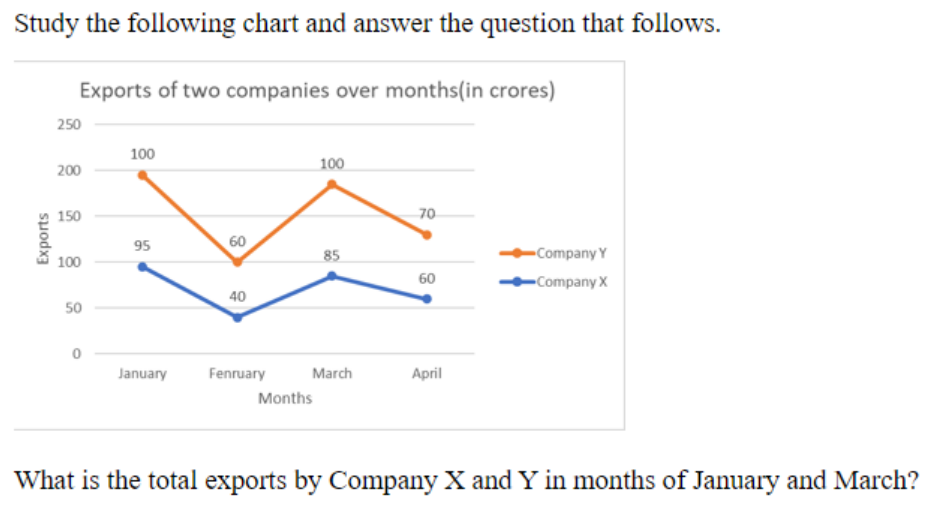
565
580
575
590
590
Sum individual components directly: (95 + 100) + (85 + 100) = 195 + 185 = 380.
Exports (in crores) for Company X and Company Y in January and March. January: X=95, Y=100. March: X=85, Y=100.
Total=(XJan+YJan)+(XMar+YMar)
Sum individual components directly: (95 + 100) + (85 + 100) = 195 + 185 = 380.
Confusing months or companies, or misreading the values from the line graph (e.g., using February or April values).
Identify January values
From the chart, for January, the export value for Company X is 95 and for Company Y is 100.
XJan=95,YJan=100
Identify March values
From the chart, for March, the export value for Company X is 85 and for Company Y is 100.
XMar=85,YMar=100
Calculate sum
Sum the values for all four entries: (95 + 100) + (85 + 100) = 195 + 185 = 380.
Total=95+100+85+100=380
D is correct because the total export value is 95 (Jan X) + 100 (Jan Y) + 85 (Mar X) + 100 (Mar Y) = 380 crore.
Always verify which data points belong to which series before performing calculations in data interpretation problems.
Get instant step-by-step AI explanations, full shift Previous Year Papers (SSC GD, RRB, SSC JE), and regional rank analysis on the official Examoogle App.
 Free Download • 100K+ Aspirants