
Join 60,000+ competitive exam aspirants
or with email
Your Cart
Subtotal₹0
Total₹0
Examoogle • User • info@examoogle.com • EE-2024-8821
Chapter 1 of 12 • Page 1 of 248🔒 Protected PDF • Watermarked
Join 60,000+ competitive exam aspirants
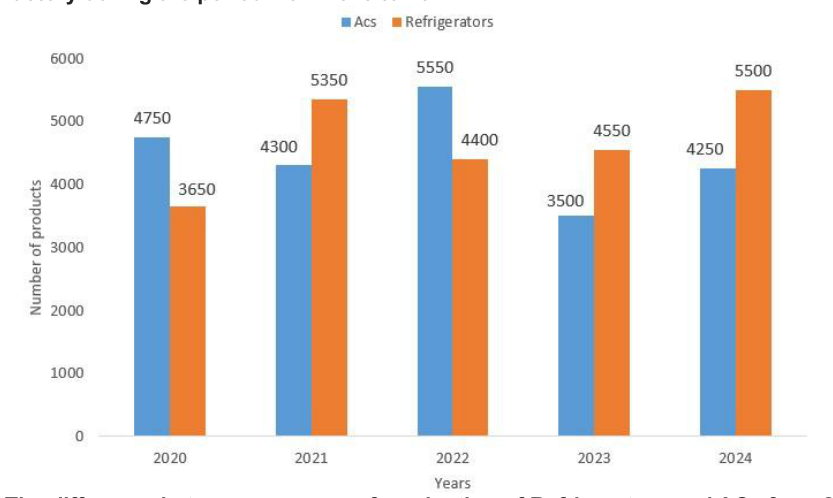
Study the following bar diagram carefully and answer the following question. The bar graph shows the production of electronic items (ACs and Refrigerators) in a factory during the period from 2020 to 2024. The difference between averages of production of Refrigerators and ACs from 2021 to 2024 is:
550
220
330
440
550
Practice and solve "Study the following bar diagram carefully and answer the following question. The bar graph shows the..." for Mathematics - Previous Year Paper 2026. The correct answer is Option A: 550. Detailed step-by-step solution, conceptual clarity, and formulas on Examoogle.
Practice and solve "Study the following bar diagram carefully and answer the following question. The bar graph shows the..." for Mathematics - Previous Year Paper 2026. The correct answer is Option A: 550. Detailed step-by-step solution, conceptual clarity, and formulas on Examoogle.