
Join 60,000+ competitive exam aspirants
or with email
Your Cart
Subtotal₹0
Total₹0
Examoogle • User • info@examoogle.com • EE-2024-8821
Chapter 1 of 12 • Page 1 of 248🔒 Protected PDF • Watermarked
Join 60,000+ competitive exam aspirants
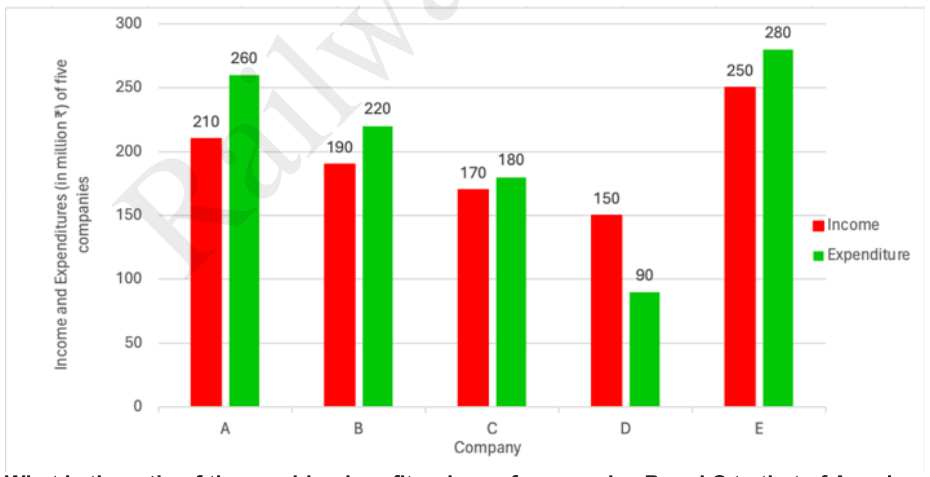
The following bar graph shows the Income and Expenditure (in million ₹) of five companies, A, B, C, D, and E, in the year 2016. The profit or loss of a company is given by 'Profit or Loss = (Income – Expenditure)'. What is the ratio of the combined profit or loss of companies B and C to that of A and E?
1 : 2
2 : 3
1 : 3
3 : 4
1 : 2
Practice and solve "The following bar graph shows the Income and Expenditure (in million ₹) of five companies, A, B, C, ..." for Mathematics - Previous Year Paper 2026. The correct answer is Option A: 1 : 2. Detailed step-by-step solution, conceptual clarity, and formulas on Examoogle.
Practice and solve "The following bar graph shows the Income and Expenditure (in million ₹) of five companies, A, B, C, ..." for Mathematics - Previous Year Paper 2026. The correct answer is Option A: 1 : 2. Detailed step-by-step solution, conceptual clarity, and formulas on Examoogle.