
Join 60,000+ competitive exam aspirants
or with email
Your Cart
Subtotal₹0
Total₹0
Examoogle • User • info@examoogle.com • EE-2024-8821
Chapter 1 of 12 • Page 1 of 248🔒 Protected PDF • Watermarked
Join 60,000+ competitive exam aspirants
The given bar graph shows electricity consumption (in kWh) for five households (Family A, B, C, D, E) over a period of three months (January to March). Which family is with the highest electricity consumption and determine how much more they consumed (in kWh) compared to the family with the lowest usage over the three- month period?
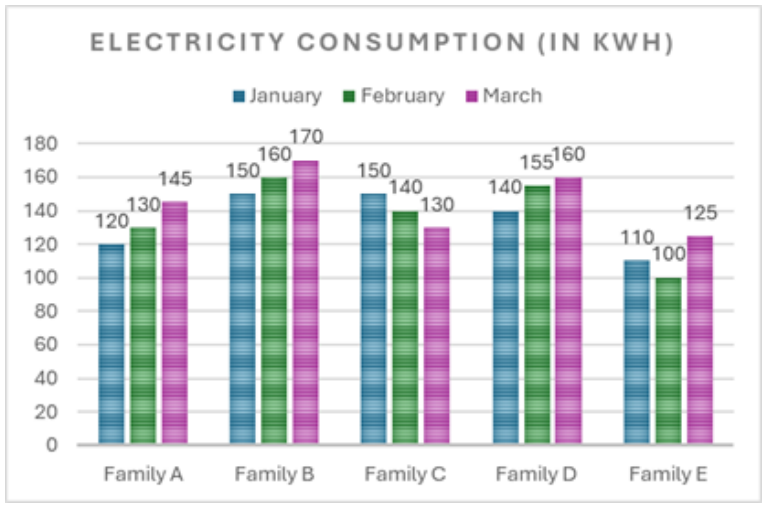
A, and 145
B, and 145
E, and 146
C, and 142
B, and 145
Practice and solve "The given bar graph shows electricity consumption (in kWh) for five households (Family A, B, C, D, E..." for Mathematics - Previous Year Paper 2026. The correct answer is Option B: B, and 145. Detailed step-by-step solution, conceptual clarity, and formulas on Examoogle.
Practice and solve "The given bar graph shows electricity consumption (in kWh) for five households (Family A, B, C, D, E..." for Mathematics - Previous Year Paper 2026. The correct answer is Option B: B, and 145. Detailed step-by-step solution, conceptual clarity, and formulas on Examoogle.