
Join 60,000+ competitive exam aspirants
or with email
Your Cart
Subtotal₹0
Total₹0
Examoogle • User • info@examoogle.com • EE-2024-8821
Chapter 1 of 12 • Page 1 of 248🔒 Protected PDF • Watermarked
Join 60,000+ competitive exam aspirants
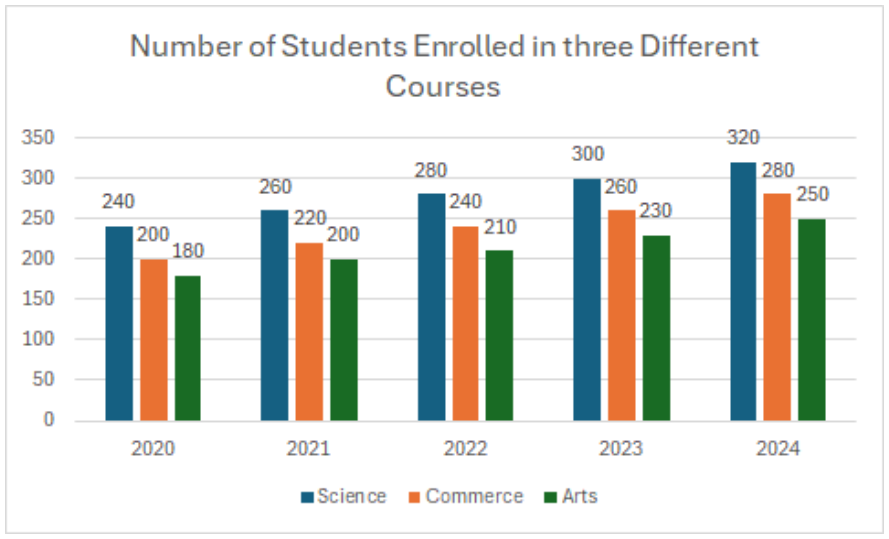
The multiple bar graph below represents the number of students enrolled in three different courses (Science, Commerce and Arts) in a college over five years. What was the average number of Commerce students enrolled over the given five years?
244
242
246
240
240
Practice and solve "The multiple bar graph below represents the number of students enrolled in three different courses (..." for Mathematics - Previous Year Paper 2026. The correct answer is Option D: 240. Detailed step-by-step solution, conceptual clarity, and formulas on Examoogle.
Practice and solve "The multiple bar graph below represents the number of students enrolled in three different courses (..." for Mathematics - Previous Year Paper 2026. The correct answer is Option D: 240. Detailed step-by-step solution, conceptual clarity, and formulas on Examoogle.