
Join 60,000+ competitive exam aspirants
or with email
Your Cart
Subtotal₹0
Total₹0
Examoogle • User • info@examoogle.com • EE-2024-8821
Chapter 1 of 12 • Page 1 of 248🔒 Protected PDF • Watermarked
Join 60,000+ competitive exam aspirants
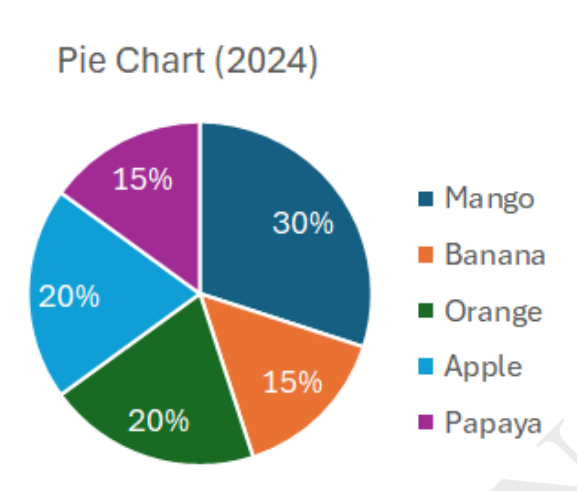
The two given pie charts show the distribution of production (in tonnes) of different fruits in a farm for Year 2023 and Year 2024. Total production: 2023 → 2400 tonnes 2024 → 3000 tonnes The production of which fruit increased by the highest percentage from 2023 to 2024?
Banana
Mango
Orange
Papaya
Orange
Practice and solve "The two given pie charts show the distribution of production (in tonnes) of different fruits in a fa..." for Mathematics - Previous Year Paper 2026. The correct answer is Option C: Orange. Detailed step-by-step solution, conceptual clarity, and formulas on Examoogle.
Practice and solve "The two given pie charts show the distribution of production (in tonnes) of different fruits in a fa..." for Mathematics - Previous Year Paper 2026. The correct answer is Option C: Orange. Detailed step-by-step solution, conceptual clarity, and formulas on Examoogle.