
Join 60,000+ competitive exam aspirants
or with email
Your Cart
Subtotal₹0
Total₹0
Examoogle • User • info@examoogle.com • EE-2024-8821
Chapter 1 of 12 • Page 1 of 248🔒 Protected PDF • Watermarked
Join 60,000+ competitive exam aspirants
Study the given graph and answer the question that follows. The graph shows the number of employees who used different modes of transport in the year 2010. What is the respective ratio between the number of employees who used Bike to the number of employees who used Metro?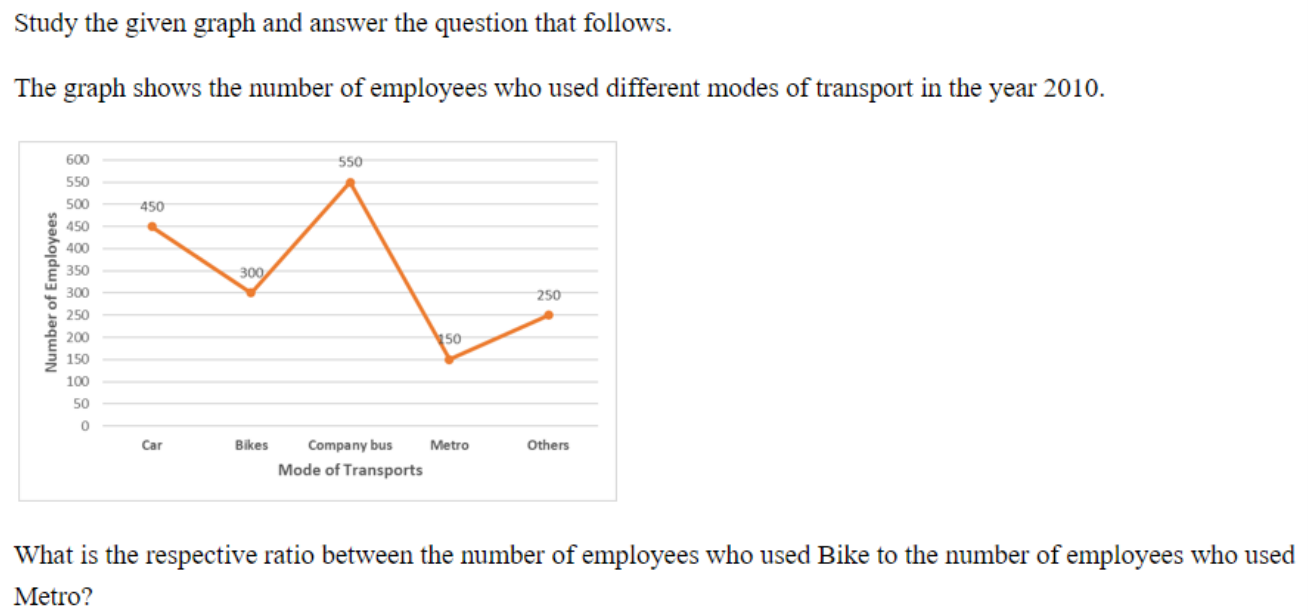
5
1
2
5:2
1
Read the values directly from the line graph for Bikes (300) and Metro (150), then simplify the ratio 300:150 to 2:1.
Number of employees who used Bike = 300, Number of employees who used Metro = 150
Ratio=Employees using MetroEmployees using Bike
Read the values directly from the line graph for Bikes (300) and Metro (150), then simplify the ratio 300:150 to 2:1.
Confusing the order of modes in the ratio and writing 1:2 instead of 2:1.
Step 1: Identify Bike Users
From the given line graph, locate the data point corresponding to 'Bikes'. The number of employees who used Bikes in 2010 is 300.
Bike users=300
Step 2: Identify Metro Users
Locate the data point corresponding to 'Metro' on the graph. The number of employees who used Metro in 2010 is 150.
Metro users=150
Step 3: Calculate the Respective Ratio
Compute the ratio of Bike users to Metro users and simplify the fraction to its lowest terms: Ratio=150300=12=2:1
Ratio=2:1
B is correct because the ratio of employees who used Bikes (300) to those who used Metro (150) simplifies to 300:150=2:1.
Data interpretation questions frequently combine graph reading with fundamental arithmetic operations like percentages, averages, and ratios.
Get instant step-by-step AI explanations, full shift Previous Year Papers (SSC GD, RRB, SSC JE), and regional rank analysis on the official Examoogle App.
 Free Download • 100K+ Aspirants