
Join 60,000+ competitive exam aspirants
or with email
Your Cart
Subtotal₹0
Total₹0
Examoogle • User • info@examoogle.com • EE-2024-8821
Chapter 1 of 12 • Page 1 of 248🔒 Protected PDF • Watermarked
Join 60,000+ competitive exam aspirants
Study the following graph and answer the given question.
The bar graph shows the annual exports (in crores) of a company during the period 2015 to 2019.
What is the respective ratio between the annual export of 2015 to the annual export of 2017?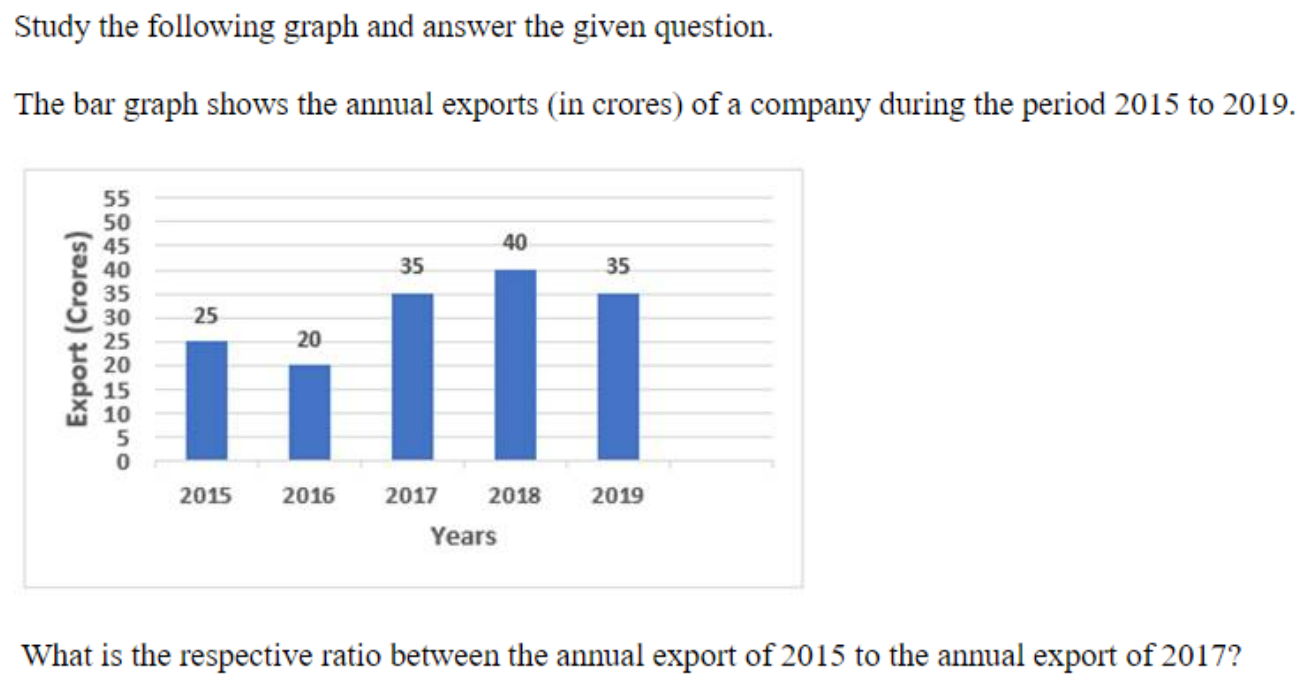
5:7
7:5
5
5:3
3
Find the values from the bar graph for the respective years and simplify the ratio directly by dividing both numbers by their highest common factor (HCF).
Annual export in 2015 = 25 crores, Annual export in 2017 = 35 crores
Ratio=Export in 2017Export in 2015
Find the values from the bar graph for the respective years and simplify the ratio directly by dividing both numbers by their highest common factor (HCF).
Confusing the order of the ratio or taking values from the wrong years (e.g., taking 2018 instead of 2017).
Identify Export for 2015
From the given bar graph, the annual export in the year 2015 is 25 crores.
Export2015=25
Identify Export for 2017
From the given bar graph, the annual export in the year 2017 is 35 crores.
Export2017=35
Calculate the Respective Ratio
Find the ratio of the annual export of 2015 to the annual export of 2017 by dividing both values by their HCF (5).
Ratio=3525=75=5:7
D is correct because the ratio of the annual export in 2015 (25) to that in 2017 (35) simplifies to 5:7.
Data interpretation questions frequently combine bar charts with ratios, percentages, and average calculations to test fundamental arithmetic skills.
Get instant step-by-step AI explanations, full shift Previous Year Papers (SSC GD, RRB, SSC JE), and regional rank analysis on the official Examoogle App.
 Free Download • 100K+ Aspirants