
Join 60,000+ competitive exam aspirants
or with email
Your Cart
Subtotal₹0
Total₹0
Examoogle • User • info@examoogle.com • EE-2024-8821
Chapter 1 of 12 • Page 1 of 248🔒 Protected PDF • Watermarked
Join 60,000+ competitive exam aspirants
Study the following graph and answer the given question. The given bar graph shows the annual production of rice in a state during the period 2018 to 2022.
[Graph: Bar graph showing production (in lakh tons) on the Y-axis (0, 20, 40, 60, 80, 100, 120) and years on the X-axis (2018-2022). Values: 2018=60, 2019=40, 2020=100, 2021=60, 2022=80]
What is the total production of rice (in lakh tons) for the years 2020, 2021 and 2022 together?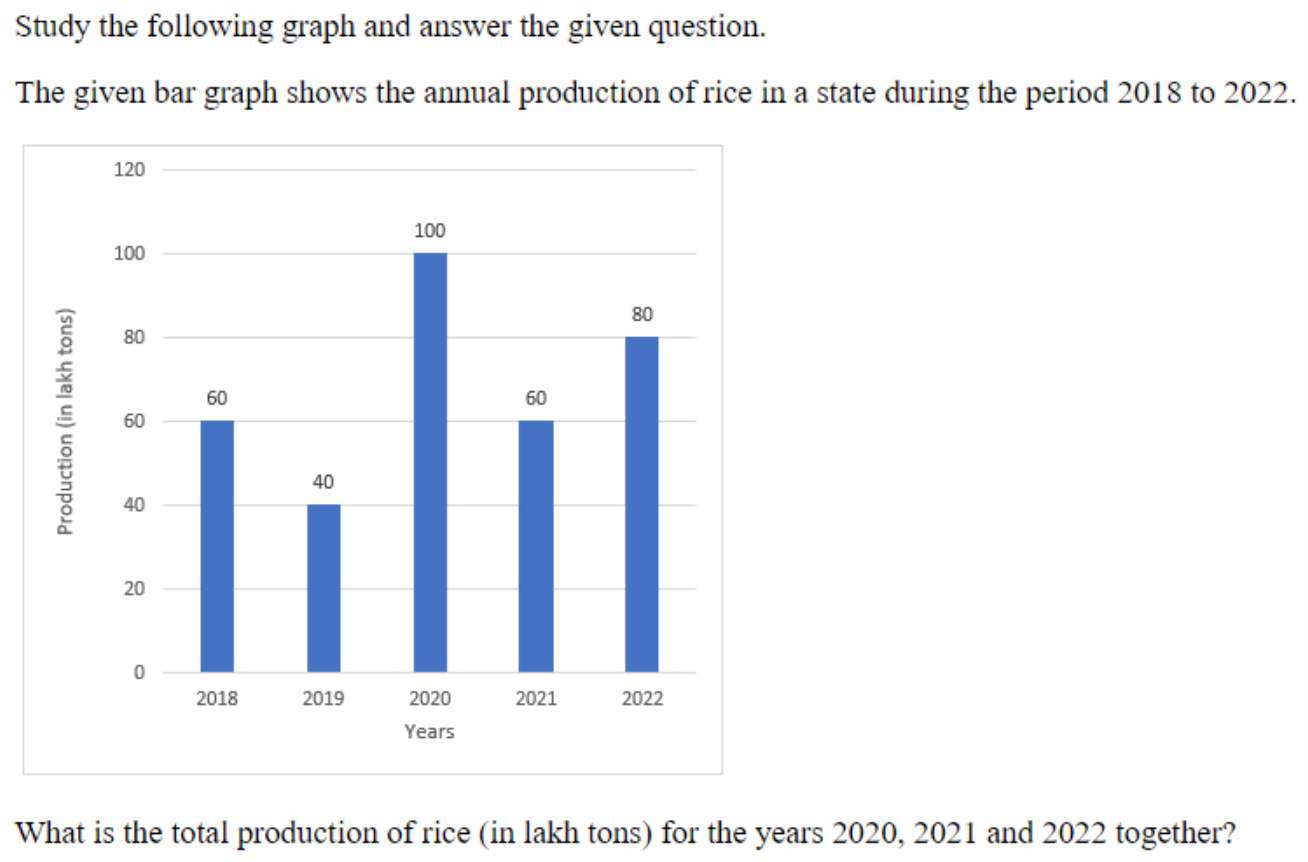
270
240
250
260
240
Directly add the numerical values given on the respective bars for the years 2020, 2021, and 2022.
Production of rice in 2020 = 100 lakh tons, Production of rice in 2021 = 60 lakh tons, Production of rice in 2022 = 80 lakh tons
Total Production=Production2020+Production2021+Production2022
Directly add the numerical values given on the respective bars for the years 2020, 2021, and 2022.
Including years outside the specified range (e.g., adding 2018 or 2019) or misreading the bar values.
Step 1: Identify Production for Each Required Year
From the given bar graph, identify the production values for the years 2020, 2021, and 2022: \n- Production in 2020 = 100 lakh tons \n- Production in 2021 = 60 lakh tons \n- Production in 2022 = 80 lakh tons
Prod2020=100,Prod2021=60,Prod2022=80
Step 2: Sum the Production Values
Add the production values for the three specified years together to find the total production.
Total=100+60+80
Step 3: Calculate Final Total
Compute the final sum: 100+60+80=240 lakh tons.
Total=240 lakh tons
B is correct because the sum of rice production for the years 2020 (100 lakh tons), 2021 (60 lakh tons), and 2022 (80 lakh tons) is 100+60+80=240 lakh tons.
Data interpretation questions frequently require careful filtering of specific categories or years before performing basic aggregate calculations like sums or averages.
Get instant step-by-step AI explanations, full shift Previous Year Papers (SSC GD, RRB, SSC JE), and regional rank analysis on the official Examoogle App.
 Free Download • 100K+ Aspirants