
Join 60,000+ competitive exam aspirants
or with email
Your Cart
Subtotal₹0
Total₹0
Examoogle • User • info@examoogle.com • EE-2024-8821
Chapter 1 of 12 • Page 1 of 248🔒 Protected PDF • Watermarked
Join 60,000+ competitive exam aspirants
Study the given graph and answer the question that follows.
The graph shows the daily production of TV sets in a factory for 6 days of a week.
[Graph: Line graph showing Number of TV (vertical axis: 0 to 500) vs Days (horizontal axis: Mon, Tues, Wed, Thu, Fri, Sat). Values are: Mon: 200, Tues: 300, Wed: 250, Thu: 400, Fri: 450, Sat: 400.]
How many units of TV sets were produced on Monday and Tuesday together?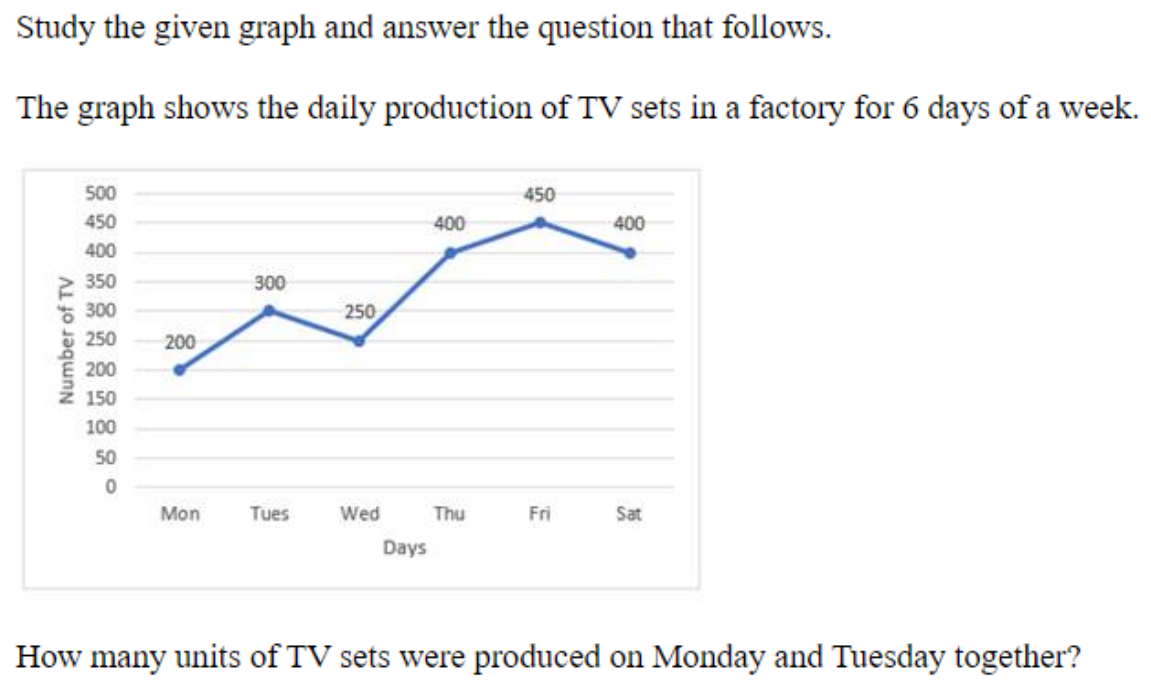
400
700
500
600
500
Directly locate the values for Monday (200) and Tuesday (300) on the given line graph and add them up.
Production of TV sets on Monday = 200 units, Production of TV sets on Tuesday = 300 units
Total TV sets=Monday Production+Tuesday Production
Directly locate the values for Monday (200) and Tuesday (300) on the given line graph and add them up.
Confusing the days or reading incorrect values from the adjacent data points.
Step 1: Read Monday's production
From the line graph, the number of TV sets produced on Monday is 200.
Monday=200
Step 2: Read Tuesday's production
From the line graph, the number of TV sets produced on Tuesday is 300.
Tuesday=300
Step 3: Calculate the total production together
Add the production values of Monday and Tuesday together: 200+300=500
Total=200+300=500
C is correct because the sum of TV sets produced on Monday (200) and Tuesday (300) is 500 units.
Data interpretation questions frequently combine simple graph reading with basic arithmetic operations like sums, averages, and percentage differences.
Get instant step-by-step AI explanations, full shift Previous Year Papers (SSC GD, RRB, SSC JE), and regional rank analysis on the official Examoogle App.
 Free Download • 100K+ Aspirants