
Join 60,000+ competitive exam aspirants
or with email
Your Cart
Subtotal₹0
Total₹0
Examoogle • User • info@examoogle.com • EE-2024-8821
Chapter 1 of 12 • Page 1 of 248🔒 Protected PDF • Watermarked
Join 60,000+ competitive exam aspirants
Study the given graph and answer the question that follows.
The graph shows the number of students involved in different after-school activities.
[Graph: Line chart plotting 'After school activities' (Y-axis: 0, 5, 10, 15, 20, 25, 30) against 'Activities' (X-axis: Sports, Study, Dance, Yoga, Watching TV). Data points: Sports=25, Study=15, Dance=10, Yoga=15, Watching TV=20.]
What is the average number of students participating in Sports and Yoga?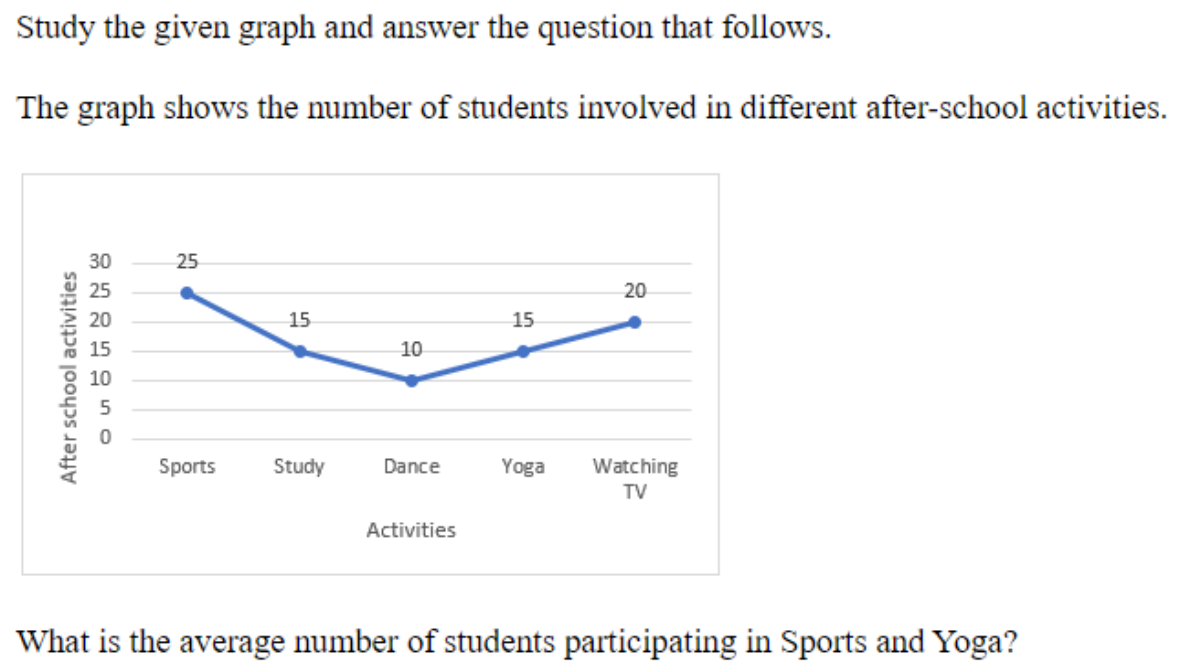
40
20
30
50
20
Since there are only two values, simply find the midpoint between 15 and 25 by adding them and dividing by 2: (25+15)/2=40/2=20.
From the line graph, the number of students in Sports = 25 and the number of students in Yoga = 15.
Average=Number of valuesSum of values
Since there are only two values, simply find the midpoint between 15 and 25 by adding them and dividing by 2: (25+15)/2=40/2=20.
Students often add all values from the graph instead of selecting only the specific activities mentioned (Sports and Yoga).
Identify required values
From the graph, identify the number of students for the activities requested: Sports is 25 and Yoga is 15.
Sports=25,Yoga=15
Apply Average formula
Calculate the sum of students in these two activities and divide by the total count (2).
Average=225+15
Calculate final result
Adding the values gives 25+15=40. Dividing by 2 yields 40/2=20.
Average=240=20
B is correct because the average of 25 and 15 is calculated as (25 + 15) / 2 = 20.
In data interpretation, always read the labels on the X and Y axes carefully to ensure you are selecting the data for the correct categories before performing any arithmetic operations.
Get instant step-by-step AI explanations, full shift Previous Year Papers (SSC GD, RRB, SSC JE), and regional rank analysis on the official Examoogle App.
 Free Download • 100K+ Aspirants