
Join 60,000+ competitive exam aspirants
or with email
Your Cart
Subtotal₹0
Total₹0
Examoogle • User • info@examoogle.com • EE-2024-8821
Chapter 1 of 12 • Page 1 of 248🔒 Protected PDF • Watermarked
Join 60,000+ competitive exam aspirants
Study the following bar graph and answer the question below.
Graph: Cancer Cases over the years
What is the average number of cancer cases over the years?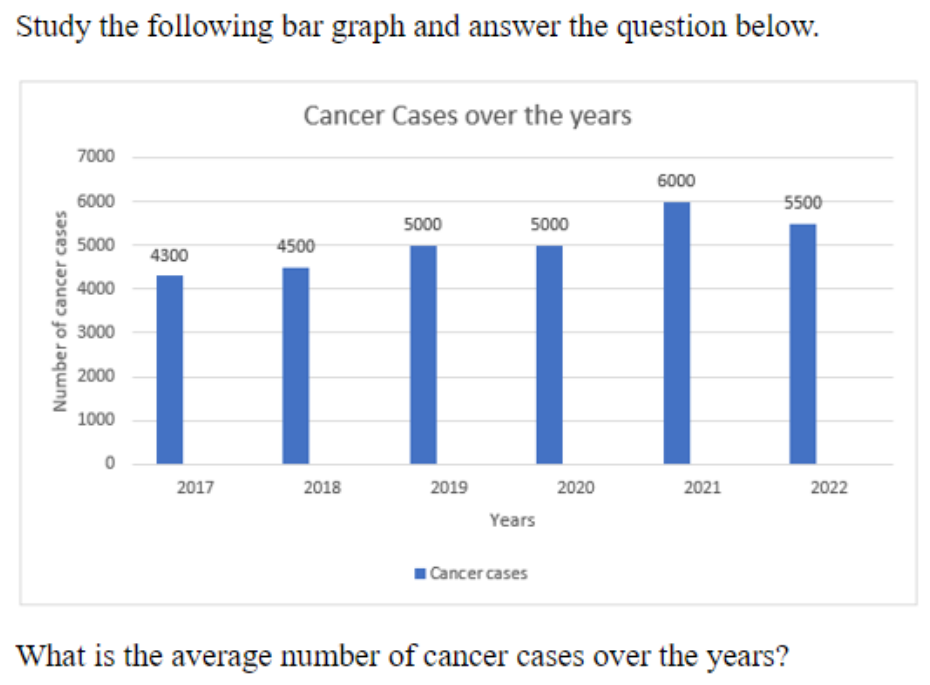
5000
5050
5100
5200
5100
Observe the numbers: 4300, 4500, 5000, 5000, 6000, 5500. Take an assumed mean of 5000, find deviations: -700, -500, 0, 0, +1000, +500. Sum of deviations: -200. Divide by 6: -33.33. Actual mean is 5000 - 33.33 = 4966.67. Since the options provided are integers, check the sum again: 4300+4500+5000+5000+6000+5500 = 30300. Then 30300 / 6 = 5050.
The number of cancer cases for the years 2017 to 2022 are 4300, 4500, 5000, 5000, 6000, and 5500 respectively.
Average=n∑xi
Observe the numbers: 4300, 4500, 5000, 5000, 6000, 5500. Take an assumed mean of 5000, find deviations: -700, -500, 0, 0, +1000, +500. Sum of deviations: -200. Divide by 6: -33.33. Actual mean is 5000 - 33.33 = 4966.67. Since the options provided are integers, check the sum again: 4300+4500+5000+5000+6000+5500 = 30300. Then 30300 / 6 = 5050.
Students often miscalculate the sum of the data points or miscount the number of years (denominator).
Identify all data points
Extract the number of cancer cases from the bar graph for each year from 2017 to 2022.
4300,4500,5000,5000,6000,5500
Calculate the total sum
Add the number of cases for all 6 years together.
4300+4500+5000+5000+6000+5500=30300
Calculate the average
Divide the total sum by the number of years (6) to find the arithmetic mean.
Average=630300=5050
C is correct because the average of the 6 given values (4300, 4500, 5000, 5000, 6000, 5500) is exactly 5050.
This type of data interpretation question appears frequently in RRB exams; always verify the sum before dividing, as minor errors here lead to selecting the wrong distracter.
Get instant step-by-step AI explanations, full shift Previous Year Papers (SSC GD, RRB, SSC JE), and regional rank analysis on the official Examoogle App.
 Free Download • 100K+ Aspirants