
Join 60,000+ competitive exam aspirants
or with email
Your Cart
Subtotal₹0
Total₹0
Examoogle • User • info@examoogle.com • EE-2024-8821
Chapter 1 of 12 • Page 1 of 248🔒 Protected PDF • Watermarked
Join 60,000+ competitive exam aspirants
Study the following bar graph and answer the question below.
[Bar Graph: Number of people who like different cuisines]
Data extracted from the bar graph:
What is the average number of people who like Indian, Chinese, Thai and miscellaneous cuisines?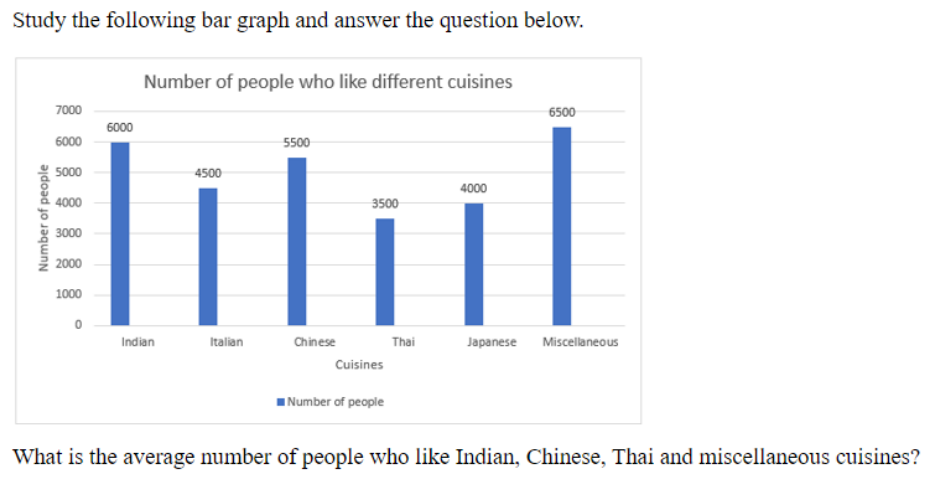
5250
5500
5750
6000
6000
Calculate the sum by grouping: (6000+5500)+(3500+6500)=11500+10000=21500. Then, 21500/4 is half of 10750, which is 5375.
From the bar graph: Indian = 6000, Chinese = 5500, Thai = 3500, Miscellaneous = 6500.
Average=n∑i=1nxi
Calculate the sum by grouping: (6000+5500)+(3500+6500)=11500+10000=21500. Then, 21500/4 is half of 10750, which is 5375.
Students often include the other categories (Italian and Japanese) in the calculation by mistake, despite the question specifically asking only for Indian, Chinese, Thai, and Miscellaneous.
Identify the relevant values
Extract the number of people for the specified cuisines from the bar graph: Indian = 6000, Chinese = 5500, Thai = 3500, Miscellaneous = 6500.
6000,5500,3500,6500
Calculate the total sum
Sum the number of people who like these four specific cuisines.
6000+5500+3500+6500=21500
Calculate the average
Divide the total sum by the number of categories (which is 4).
Average=421500=5375
D is correct because the average of 6000, 5500, 3500, and 6500 is 5375.
Data interpretation questions often require selecting specific subsets of data; always double-check the labels against the question text to avoid miscounting.
Get instant step-by-step AI explanations, full shift Previous Year Papers (SSC GD, RRB, SSC JE), and regional rank analysis on the official Examoogle App.
 Free Download • 100K+ Aspirants