
Join 60,000+ competitive exam aspirants
or with email
Your Cart
Subtotal₹0
Total₹0
Examoogle • User • info@examoogle.com • EE-2024-8821
Chapter 1 of 12 • Page 1 of 248🔒 Protected PDF • Watermarked
Join 60,000+ competitive exam aspirants
Study the given bar graph and answer the question that follows. The given bar graph shows the number of students from different schools enrolled in different classes. Which class has the maximum students from school C?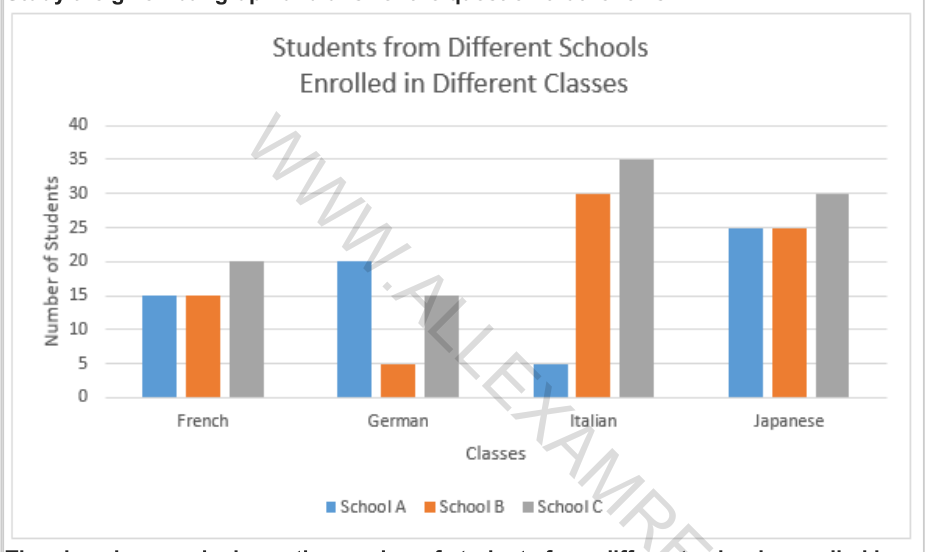
French
German
Italian
Japanese
German
Look only at the grey bars (representing School C) for each category on the X-axis and identify the one with the highest vertical peak.
Look only at the grey bars (representing School C) for each category on the X-axis and identify the one with the highest vertical peak.
Identify School C representation
According to the legend, School C is represented by the grey-colored bars in the bar graph.
Compare heights for School C
Comparing the heights of the grey bars for each class: French = 20, German = 15, Italian = 35, Japanese = 30. The highest value is 35.
Final Conclusion
Since 35 is the highest value among the grey bars, the Italian class has the maximum number of students from School C.
A: German has only 15 students; C: Japanese has only 30 students; D: French has only 20 students.
B is correct because the grey bar representing School C reaches the maximum height of 35 in the Italian class.
Always ensure you are reading the correct legend color before comparing values to avoid selecting data for the wrong school or category.
Get instant step-by-step AI explanations, full shift Previous Year Papers (SSC GD, RRB, SSC JE), and regional rank analysis on the official Examoogle App.
 Free Download • 100K+ Aspirants